
LogicalWireless’s End-of-Year Volume Analysis: Comparing Device Trade-in Trends for 2019 vs 2020

As a leading supplier of wholesale iPhones and Android devices. LogicalWireless is able to track trends in used cell phone supply on a weekly basis. In this post, we share our insights with you regarding volume trends over the last four months of 2020 versus 2019. If you are a reseller of second-hand mobile devices. These trends are critical to track so that you can plan your procurement strategy for the first quarter of 2021.
Our Methodology
LogicalWireless tracks weekly volumes from all major suppliers in the industry. This puts us in a position to share rich insights with our customers. In this analysis, we compare volume trends over. The last 16 weeks of 2020 versus the same time period in 2019. The following graph summarizes the respective supply trends for 2019 and 2020:
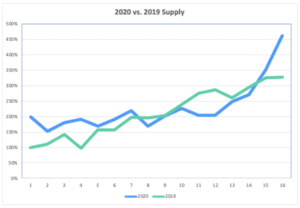
We chose to analyze the 16 week period from September through the end of the year. As this period coincides with both the latest iPhone release and the holiday season. We excluded the final week of the year (the week of New Year’s). As this is typically a bit of a dead zone in terms of industry activity. We have benchmarked all volumes against September 2019 volume, which appears as 100% on the graph. For instance, The first point in the graph. Which represents volume in the first week of the 16 week period, shows that volume in 2020 started out at about twice the level as the same time period in 2019. In this way, we can make an apples to apples comparison of volume during each week in the period.
The Big Takeaways
As mentioned earlier, overall volume in 2020 started at about twice the level as in 2019. This is due not only to overall growth in industry volume. But also to LogicalWireless‘s continually expanding access to supply. Given the fact that these numbers not only reflect industry activity but also our internal efforts to expand supply. The starting point is less relevant as an overall industry measure than the shape of the curve over the subsequent 15 weeks.
The first point to note is that that trade-in activity began a full month later in 2020 than in 2019 (week eight versus week 12). This is not surprising given the fact that 2020’s iPhone 12 was released a full month later than 2019’s iPhone 11 (Oct. 23 vs. Sept. 20). As LogicalWireless has covered in previous blog releases. The iPhone 12 just barely made its traditional fall release this year due to production backlogs stemming from COVID-19 disruptions.
Another potential reason for the delay in trade-in volume for 2020 was an increase in mail-in trades. Traditionally, consumers trade-in phones in person at retailers. Most retailers prefer this method because it allows for smoother trade-in procedures. And customers can have their devices inspected on the spot. The rise of social distancing and online transactions meant that more consumers conducted trade-in transactions by mail. This method presents a learning curve for consumers. Because they are required to fill out assessments online before physically shipping their phones. Mailing and processing times also pushed back the trade-in spike.
Due to the earlier start in 2019, volume in 2019 soared past 2020 volume in weeks 10 through 12, but as 2020 trade-in volumes began to pick up steam, this gap was quickly closed. From week 12 onward, we see an exponential increase in 2020 volumes. The apparent hockey stick growth in volume is far steeper than any increase we saw in 2019. This is indicative of the huge success of the iPhone 12 series as well as the myriad December trade-in deals from retailers like Best Buy, Walmart, and Target, which may have enticed consumers to jump to a new device.
What Do These Trends Mean for 2021?
The data show that trade-in volume in 2020 was still very much on an upward trajectory as we moved towards the end of the year. Volumes during this 16 week period grew roughly 230% and ended 40% higher than volume during the same time in 2019. If the trend continues, we can expect big volumes well into the first quarter of 2021.
Final Thoughts on 2019 and 2020 Trade Volumes
Many factors impacted trade-in activity in 2020, but one outweighed them all: Apple finally released its highly anticipated 5G phone. This is likely what pushed more people to trade in their devices in what otherwise may have been a very lackluster, sluggish year for new phone sales. Many loyal Apple customers had been hanging on to their devices in anticipation of the 5G device unveiled in 2020.
LogicalWireless expects 2021 to be a strong year for the industry. We will continue to offer buyers access to in-demand devices with fast shipping through our Online Stock Lis. Our partnerships with major carriers, manufacturers, and big-box retailers enable us to source in-demand devices before testing, grading, and warehousing those devices at our facility in Edgewood, New York. As a leading supplier of wholesale iPhones and Android devices, our goal is to help customers get fast, easy access to the inventory they need throughout